Renewable Energy Overview
Renewable Energy Factors
The Nevada economic development plan, “Moving Nevada Forward” identifies Clean Energy as a targeted industry because of its tremendous potential for growth in manufacturing renewable components, transmission capacity, geothermal development, and energy efficiency technologies
The California plan, “An Economic Growth and Competitiveness Agenda for California” also focuses on “Clean Economy” as a path for economic development. “Clean Economy” encompasses the sectors that produce all goods and services with an environmental benefit.
Clean Energy Technologies
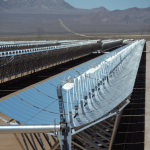
Solar energy technologies produce electricity from the energy of the sun. Solar energy technologies potentially suitable for utilty-scale applications include: Photovoltaic (PV) and Concentrating Solar Power (CSP). PV technology utilizes specially designed materials to absorb light energy from the sun’s rays and convert it directly to electricity while consuming little water (to wash/maintain equipment). CSP is a type of solar thermal technology which uses mirrors to reflect and concentrate sunlight onto receivers that collect solar energy and convert it to heat. This thermal energy can then be used to produce electricity via a steam turbine or heat engine that drives a generator.
Solar energy is considered “clean” because it avoids combustion of fossil fuels which release greenhouse gases. However, most solar thermal technologies require large quantities of water. For more information see: http://energy.gov/eere/renewables/solar
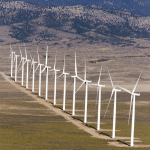
Wind power or wind energy describes the process by which the wind is used to generate mechanical power or electricity. Wind turbines convert the kinetic energy in the wind into mechanical power. This mechanical power can be used for specific tasks (such as grinding grain or pumping water), or can be converted into electricity by a generator (U.S. Department of Energy).
Historically, wind energy captured by small wind mills was used to power water pumps to fill livestock tanks in remote locations. The new wind industry utilizes turbines of different sizes positioned at various heights to generate electricity for small and large scale applications. (Spring Valley Wind farm photo at top of page credit: Pattern Energy Group LP).
Geothermal energy uses reservoirs of water warmed by heat stored in rock formations beneath the earth’s surface. Wells can be drilled into the underground reservoirs to tap steam and very hot water that can be brought to the surface for use in a variety of applications, including electricity generation and for heating and cooling. Electricity is produced when hot water and steam is pumped to the surface and used to run turbines to generate electricity. Geothermal resources of low- to moderate-temperature water provide direct heat for residential, industrial, and commercial uses (U.S. Department of Energy).
Geothermal energy is sought after by utilities and transmission operators because it provides dependable and consistent base load energy as opposed to intermittent energy like that produced by wind and solar resources.
Water power in the form of hydroelectric generation may be available where streams can be tapped to run turbines. This type of energy is particularly useful as it can be quickly stopped and started again as demand fluctuates. Although large scale hydroelectric generation would entail extraordinarily robust permitting in the arid southwest making it a less feasible option, micro-hydroelectric generation may be a viable option for smaller scale needs. For more information see: http://energy.gov/eere/renewables/water
Biomass: Plant materials and materials from animal, construction, and food industry waste may be used to produce biofuel. Pinyon-juniper woodlands are a potential bioenergy production source within the RDSBC region. For more information see: http://energy.gov/eere/transportation/bioenergy
Industry Opportunities
Load-serving utilities obtain power from generation facilities they own and operate or through power purchase agreements (PPAs). A PPA is a contract between an independent power producer and an electric utility which sets forth the terms and conditions under which power is generated and purchased. Currently, the best market for new renewable energy products is southern California. Developers from as far away as Canada and Wyoming are proposing generation and transmission projects in hopes of obtaining a market share in the area. Projects in the RDSBC footprint must compete with these projects, but California law clearly sets precedence for preferring regionally produced power. In open access markets, generation facilities have the option of selling power directly to a private offtaker such as a mining operation.
California and Nevada have both enacted Renewable Portfolio Standards (RPS), mandating a certain level of renewable energy procurement by load serving entities. California Senate Bill (SB) X1-2 codified California’s 33 percent RPS by 2020 goal and applied the mandate to all electricity retailers in the state. The California law sets interim goals of 20 percent by 2013 and 25 percent by 2016.
Nevada’s RPS mandate only applies to the Investor-Owned Utility, NV Energy. Nevada Revised Statutes 704.7800 “Portfolio Standard” defines the entities to which the RPS is applicable. For calendar year 2011, Nevada RPS required not less than 15 percent of electricity sold to Nevada customers come from renewable energy resources and not less than five percent of that amount must be acquired from solar resources. The Nevada RPS is set to increase to 18 percent in 2013 and 2014, 20 percent for the years 2015 through 2019, 22 percent for the years 2020 through 2024, and 25 percent for 2025 and beyond.
The RDSBC area is vast with few long distance high voltage transmission lines. Development of such transmission lines, including upgrading interties between California and Nevada in the area of the RDSBC is moving forward though regional transmission coordination groups, such as the Western Electricity Coordinating Council (WECC), and other subregional groups. However, long distance high voltage transmission lines take many years to permit and construct. In the interim, there may be a preference for smaller-scale (less than 20 MW) projects which use existing transmission capacity. California energy policy mandates a significant percentage of the RPS be achieved through implementation of 12,000 MW of distributed generation (DG), which may be achieved cross-border in Nevada as well as in California.
Utility Table
Coalition load serving utility information for five of the seven members is summarized in a PDF version of the Utility Table.
RDSBC Regional Map
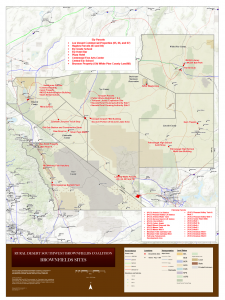
This map highlights the seven members of the RDSBC region which include five Nevada counties: Esmeralda, Lincoln, Mineral, Nye, and White Pine, one California county: Inyo, and the Duckwater Shoshone Reservation.
The large format map shows the location, capacity, and status of power transmission lines, substations, and switches, and assessed RDSBC brownfield sites in the context of major roads and land status.
Click on the map (right) to view or download a 34 x 44″ PDF version of the map. This is a large file and may take a while to display.
Renewable Energy Resource Maps for Each Coalition Member
Regional Renewable Energy Resource maps (below) have been prepared for the Coalition members. Each of the maps show solar, geothermal, wind, biomass, and transmission line resources, except for the Duckwater map, which shows solar, geothermal, wind, and transmission line resources.
- Solar resources are shown for Concentrating Solar Power (CSP) and tilted Photovoltaic (PV). CSP uses Direct Normal Insolation (DNI) data and PV uses solar resource available to a photovoltaic panel, oriented south at an angle. The solar resource is in units of kWh/m2/day annually averaged for 1998-2009 over 10 sq km surface cells. The data were developed by SUNY Albany and the National Renewable Energy Laboratory – NREL.
- The Geothermal Resource map ranks favorability for Geothermal Potential on the ability to predict geothermal systems based on many factors as related to known geothermal systems. These data were presented in the Nevada Bureau of Mines and Geology Map 151 by Coolbaugh and Others (2005).
- The Wind Resource map shows the annual average Wind Resource at 50-meter height above ground surface based upon potential Wind Power Density in W/m2 (watts per meter squared). Wind power is divided into seven classes, where class 3 or greater areas are suitable for most utility-scale wind turbine applications, class 2 areas are marginal for utility-scale applications but may be suitable for rural applications, and class 1 areas (not shown) are generally not suitable. These data were developed by AWS TrueWind/NREL (2003).
- The Biomass Resource map displays the location of Great Basin Pinyon-Juniper Woodland as a biomass energy resource. Mapped Pinyon-Juniper woodlands were extracted from the Southwest Regional GAP Landcover (SWReGAP, 2004) for Arizona, Nevada, and Utah and the California GAP Landcover (2008).
- Electric utility service areas are delineated and are from the Nevada Rural Electric Association, Valley Electric Association (VEA), NV Energy, and the California Energy Commission. Photointerpreted transmission lines and substations (including switches) for capacities 230 kV or greater are also shown. Selected transmission lines and substations with lesser capacities are shown for the intertie area between VEA and Southern California Edison service areas. Transmission facilities are provided for informational purposes only and may not be complete, especially outside the RDSBC.
CLICK ON A MAP IMAGE below to view or download the PDF version of the map. Each of the maps are 34″ x 44″, except for the 34″ x 22″ Duckwater Shoshone map. Please note: the files are large and may take a while to display.


